Track Shop-Floor Cycle Time and Discover Unseen Manufacturing Data Using Cameras and AI
Many manufacturers know how many products leave the line at the end of a shift. However, they may not know exactly how much time is spent on every step, why one workstation runs slower than another, where operators wait for materials, or which process deviations reduce throughput.
Traditional production systems record machine signals, work orders, and finished quantities. Manual and semi-automated operations often remain less visible because their individual steps are not automatically recorded.
Intelgic brings visibility to these operations by deploying cameras and AI assistants at manufacturing workstations.
The AI observes processes through the cameras, recognizes individual actions, verifies that work instructions are followed, and measures the duration of each step. Intelgic then synchronizes these events with production data, work orders, product variants, and customer demand.
The result is detailed manufacturing analytics built from information that was previously unseen.
What Is AI-Based Cycle-Time Tracking?
AI-based cycle-time tracking uses cameras and computer vision to determine when a manufacturing process and its individual steps begin, progress, and finish.
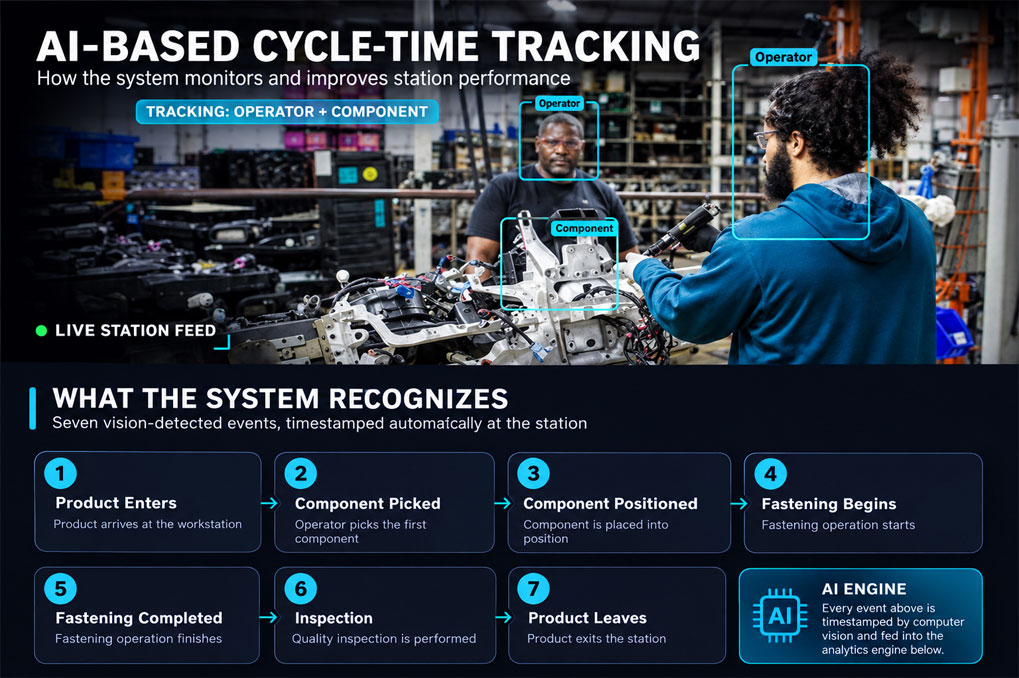
Instead of relying only on an operator to start a timer or scan a code, the AI recognizes actual process events.
The AI records timestamps for these events and calculates total station cycle time, time spent on each process step, waiting time between steps, repeated-step duration, correction and rework time, product-transfer time, idle time, and actual productive time.
This creates a much more detailed view than measuring only the time between product entry and exit.
Understanding Cycle Time, Takt Time, Throughput, and Lead Time
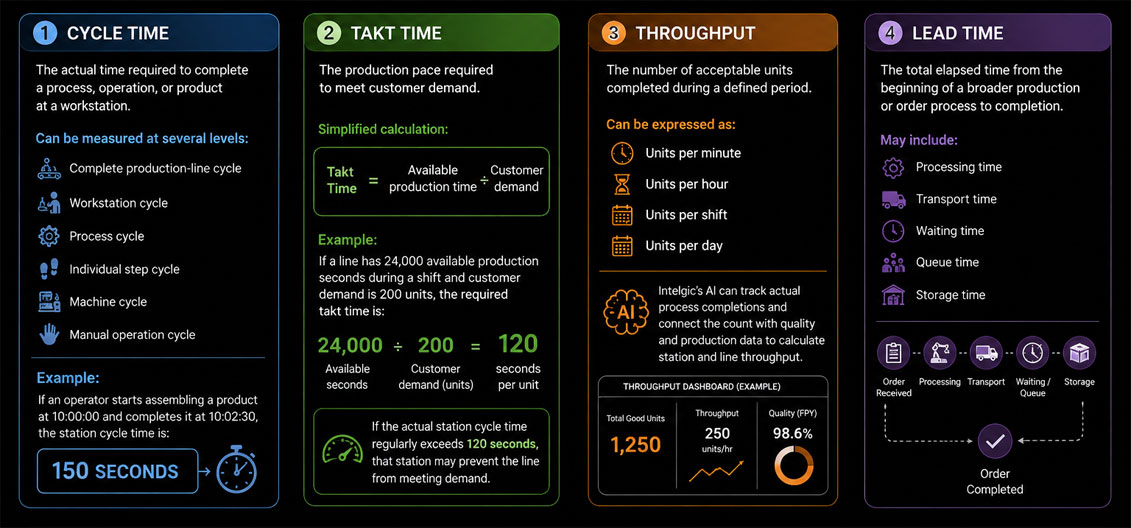
These terms are related but measure different aspects of production.
Cycle time is the actual time required to complete a process, operation, or product at a workstation.
For example, if an operator starts assembling a product at 10:00:00 and completes it at 10:02:30, the station cycle time is 150 seconds.
Takt time is the production pace required to meet customer demand.
If a line has 24,000 available production seconds during a shift and customer demand is 200 units, the required takt time is 120 seconds per unit. If actual station cycle time regularly exceeds 120 seconds, that station may prevent the line from meeting demand.
Throughput is the number of acceptable units completed during a defined period.
Intelgic's AI can track actual process completions and connect the count with quality and production data to calculate station and line throughput.
Lead time is the total elapsed time from the beginning of a broader production or order process to completion. It may include processing, transport, waiting, queue, and storage time. By separating these measurements, manufacturers can understand whether a performance issue comes from slow processing, waiting, excessive work in progress, rework, or inadequate capacity.
The Unseen Data at a Manufacturing Station
A conventional production report may show that a station completed 350 units during a shift. It may not reveal what happened within those 350 cycles.
These events may last only a few seconds. When repeated hundreds or thousands of times, they can have a significant effect on throughput.
Intelgic converts these actions into structured process data that can be measured and analyzed.
How Intelgic's Camera-Based AI Assistants Work
Intelgic deploys cameras, AI software, and operator-assistance interfaces at selected manufacturing stations.
Industrial cameras are positioned to capture relevant areas such as operator work zones, component bins, assembly fixtures, tools, product-transfer points, inspection areas, packaging locations, and material-loading positions.
The camera configuration is designed around the events that must be recognized.
Intelgic's AI analyzes the visual stream and identifies actions such as product arrival, product departure, component picking, tool selection, part positioning, drilling, fastening, assembly, inspection, packaging, labeling, material movement, rework, and process completion.
Each recognized event receives a timestamp and becomes part of the station's digital process history.
The required process is configured as a sequence of expected events. A digital work instruction may specify: scan or identify the product, pick Component A, position Component A in the fixture, install two fasteners, connect the cable, perform the inspection, and transfer the completed product.
This makes cycle-time measurement and work-instruction verification part of the same AI workflow.
The system records the start and completion time of each detected step. For every production cycle, Intelgic can calculate total station cycle time, value-adding process time, waiting time, idle time, step duration, material-picking time, tool-usage time, inspection time, correction time, transfer time, and repeated-step time.
These measurements can be connected with the product, work order, station, shift, and production batch.
If the AI detects a deviation, delay, or missed step, it can assist the operator through workstation displays, visual instructions, audio alerts, stack lights, Andon systems, tablets, projected guidance, connected tools, and PLC-controlled signals.
Alerts can be configured to guide the operator without unnecessarily interrupting production.
Visual process events become more valuable when they are connected with manufacturing context. Intelgic can integrate with MES, ERP, SAP, PLCs, SCADA, digital work instructions, Bills of Materials, quality-management systems, production databases, warehouse-management systems, tool controllers, order-management platforms, and customer-order data.
Station-Level and Step-Level Cycle-Time Analytics
Intelgic can measure and compare performance at every instrumented station. A station dashboard may show:
A live status can indicate whether the station is:
Station-level averages can hide the actual source of a delay. Step-level analytics show which part of the process is changing.
For example, the total station cycle may have increased by 12 seconds. Step-level analysis may reveal that component-picking time increased by 9 seconds because the line-side container was moved farther away.
This level of detail allows teams to investigate specific process conditions rather than relying on general assumptions.
Calculating Manufacturing Throughput
Throughput can be calculated from AI-recognized process completions.
At line level, throughput can be based on the completed output of the final relevant station. The calculation can account for good units, reworked units, rejected units, incomplete cycles, product variants, planned and unplanned stops, shift schedule, and work-order changes.
Combining throughput with quality data prevents defective or incomplete units from being treated as successful production output.
Matching Production Pace with Customer Orders
Customer-order data defines what must be produced, in what quantity, and by what deadline. Intelgic can synchronize actual production events with customer orders, sales orders, production orders, required quantity, product mix, planned completion time, shipping deadline, and available production time.
This connects real-time shop-floor behavior with delivery performance.
Finding Bottlenecks with AI
A bottleneck is the process or resource that limits overall production flow. Intelgic can help locate bottlenecks by analyzing station cycle time, queue formation, product waiting time, blocking and starvation, work-in-progress accumulation, step duration, rework frequency, station utilization, throughput, and variation over time.
The slowest average station is not always the true bottleneck. A station with high variation or frequent micro-stoppages may constrain the line even when its average appears acceptable. Camera-based data provides additional context by showing which physical events accompany the delay.
Short interruptions are often missed by conventional downtime reporting because they are too brief to trigger manual documentation.
Intelgic can record these events and calculate their cumulative effect. A five-second delay repeated 500 times creates more than 41 minutes of lost production time.
Understanding Cycle-Time Variation and Work-Instruction Compliance
Average cycle time alone does not show whether a process is stable. Two stations may both average 90 seconds. One may consistently operate between 88 and 92 seconds, while the other varies between 60 and 120 seconds.
High variation may indicate inconsistent material availability, unclear work instructions, difficult product variants, workstation-layout problems, tool issues, or repeated corrections.
Cycle time should not be improved by skipping required work. Intelgic measures process duration while also verifying that expected steps are completed.
A short cycle is not treated as a positive result if mandatory operations were omitted.
Different product variants may require different components, tools, or process steps. Intelgic can compare cycle time by product model, variant, option package, work order, component combination, and customer configuration.
The analysis may show that one variant consistently requires additional time at a particular step. Teams can then update line balancing, work instructions, tooling, staffing, or scheduling.
Manufacturers can compare process behavior across workstations, production lines, shifts, facilities, products, and time periods. The objective is to identify process patterns and improvement opportunities, not to draw conclusions from isolated operator-level measurements.
Real-Time Production Dashboard and Historical Analytics
Historical data helps teams understand patterns beyond the current shift. Intelgic can analyze hourly, daily, weekly, and monthly trends; cycle-time changes; step-duration trends; throughput trends; order-performance history; recurring bottlenecks; process-deviation trends; material-related delays; rework patterns; and results following process changes.
Filters can be applied by station, product, variant, line, work order, batch, or time period.
When a cycle exceeds its target, authorized users may review which step caused the delay, what event occurred before the delay, whether material was available, whether an action was repeated, whether the wrong component was initially selected, whether the product required correction, whether the station was blocked or starved, and whether a work-instruction deviation occurred.
Configured image or video references can support investigation according to the organization's data-governance policies.
AI Assistance at Every Station and the Intelgic Certainty Platform
Combining these roles creates a feedback loop between execution and improvement.
Intelgic's Certainty platform can coordinate camera connectivity, AI analysis, process logic, production integration, and analytics. For cycle-time tracking, Certainty can:
Each station can operate with its own workflow while contributing data to a line-level manufacturing view.
Factory-System Integration
The integration creates context around each observed process event.
Every manufacturing cycle can create a structured record containing:
This record connects the physical manufacturing process with its digital production history.
Responsible Use and Implementation of AI Cycle-Time Tracking
Camera-based manufacturing analytics should be deployed with transparent governance. Organizations should define:
Analytics should be interpreted in process context. Station design, product mix, material availability, equipment conditions, and upstream constraints can all affect cycle time.
By combining current throughput, remaining order quantity, cycle-time trends, and station conditions, Intelgic can estimate when an order is likely to be completed. The projection can be updated as production conditions change.
The estimate is an operational projection rather than a guarantee, but it provides planning teams with a more current view than a fixed schedule.
A typical implementation follows these stages:
Data That Was Previously Unseen
A production line contains thousands of small actions that are rarely converted into structured information. Intelgic's cameras and AI assistants make it possible to measure:
This turns the shop floor into a source of continuous, actionable manufacturing intelligence.
See Every Step. Measure Every Cycle. Improve the Complete Line.
Intelgic deploys cameras and AI assistants across manufacturing workstations to observe process execution, verify work instructions, measure cycle time, and calculate throughput.
The system connects these physical events with production plans, product variants, work orders, and customer demand. Certainty then converts the combined data into detailed dashboards, alerts, traceability records, and operational insights.
Manufacturers can finally see the information hidden between the start and completion of each production cycle.